The history behind Halloween and the real monster living inside Nerdify!
Halloween is so old, we are not even sure who started celebrating it first. It probably began in Celtic speaking countries (modern United Kingdom) and has originated from ancient harvest rituals and the celebration of the Celtic New Year, which Celts believed to be a magical time, when the dead would “sneak in” from the spirit-realm and wander around the Earth, like so 😉 Celts used to lit huge bonfires to drive the dead spirits away.
When Romans invaded Britain, roughly 2000 years ago, they’ve merged this holiday with their own – Feralia (Roman festival celebrating the dead and deceased). It is interesting to note that other cultures, halfway around the globe, also celebrated their dead at this time of the year. For example – Day of the Dead in Mexico (Dia de Muertos). Last Bond movie portrays this holiday in the opening scene.
Merging these two traditions (evil spirits walking the streets and celebrating the dead) has given the modern Halloween such a colorful and playful character.
What is “trick or treat”?
Again, several versions on this one. Probably comes from a tradition from the medieval times, when poor would go from door to door asking for food or money in exchange for prayers honoring the dead (since Halloween was about celebrating the people who passed away).
Another version comes from an ancient belief that souls of the dead were wondering around in the night and needed to be appeased. Giving gifts and/or food was a way of doing that.
Halloween came to the USA during the immigration wave from Ireland and England in the late nineteenth century. It quickly became a popular holiday all across the USA.
Today, we celebrate Halloween as an opportunity to unwind and laugh, play jokes on our colleagues and have a good time. That’s precisely why Halloween has spread across the world – everyone can have fun in their own way.
Since sweet treats are such a big part of Halloween, we’d like to share an absolutely insane looking witch finger cookies recipe with you. It blew our minds at the office, made our celebrations that tiny bit more exciting 🙂 Enjoy!
P.S. Oh, right! We wanted to show you the real monster living at Nerdify 🙂 Well, here it is:
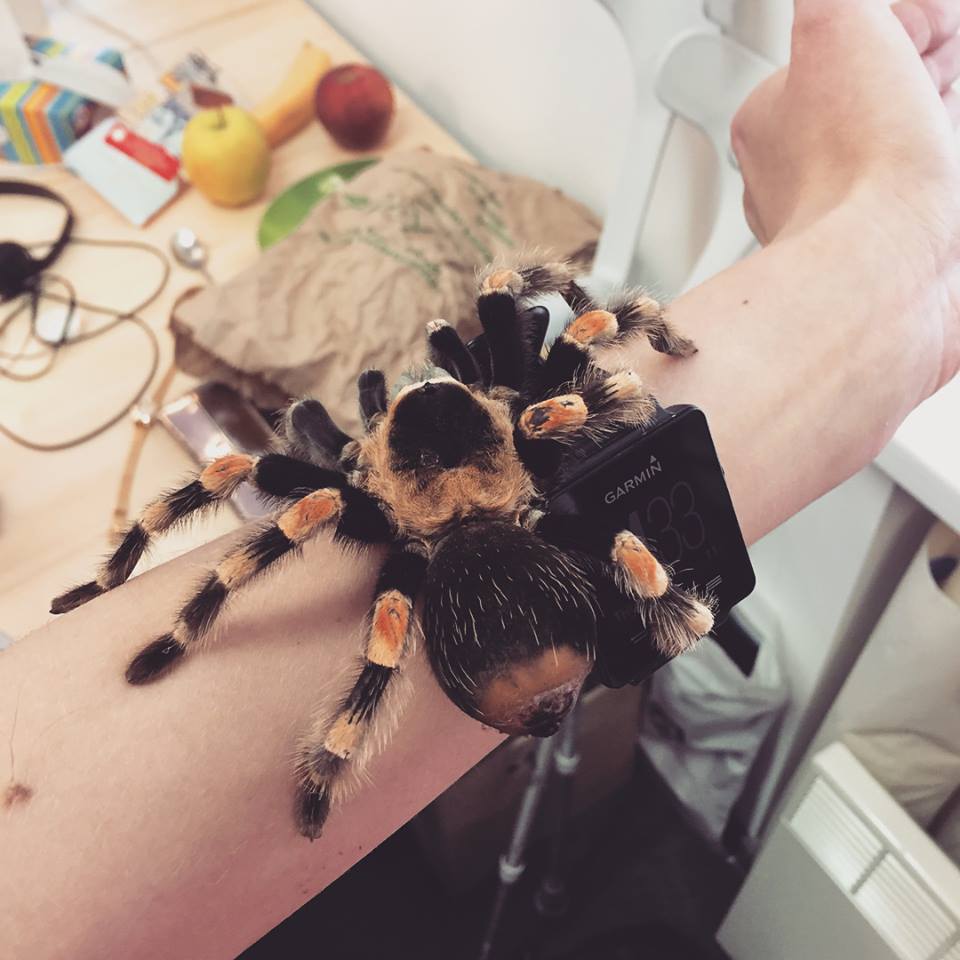
Yep, we have a giant spider living inside our office! This adorable beauty is called Nick (weird name for a spider, I know). That’s a tarantula and, theoretically, it can eat a small bird or a mouse! In reality, though, Nick is really shy and actually quite lazy. Pretty much sits all day in the corner and kills an unfortunate bug once a week (that part is exciting to watch). We have him in the office to keep our Nerds “on the edge” if you know what I mean 😛
Happy Halloween everyone!
-
January 27, 2021
Just come to think of it: the social distancing, travel bans, daily restrictions, and online learning have made us so far away from each other, yet it is also the first time in a while that the world has been affected by something that big and challenging. Our Nerdify reviews team decided to ask students from all over the world and explore the ways how they cope with Covid-19. Of course, most college students these days are either taking a break from their studies and focus on exams or special courses or use online learning as a temporary learning remedy. Still, what we are after now is the selection of great ideas that can make students proud.
British students have turned to arts, physical education, and music to host online campaigns that would help the NHS to receive more medical masks. Students from all over the country organize performances and challenges right at the backyards of their homes. It helps to collect some funds that are aimed at buying masks for those who are truly on the frontline these days. Some other college students turn to the local scouting units and help the youngsters organize online games, read stories, or have fun the best way possible. It can only be applauded to such a practice!
Norwegian college students have faced numerous academic disruptions, which is why some of the brightest ones among them decided to host virtual meetings and help the college professors with some lectures. Although it is not purely Norsk as a practice, it has been supported by their Swedish and Danish academic fellows. It is an example of when modern technology has been used wisely to fight the Covid-19 challenges and help each other learn the best way possible. Our Nerdify reviews team hopes that our small posts will help you out as well and will keep you inspired as we are all in this together!
College students in Belgium belong to a great youth network called KSA, which stands for Catholic Students Association. Even though the majority of their activities have been canceled, the witty students decided to organize online parties, quizzes, and competitions for the youngsters. Dedicating all their time and passion, Belgian students decided to focus on the most vulnerable and give their hearts to the children. Our Nerdify reviews team believes that focus on a joint education experience is a great way to improve one’s social skills and add a valuable part to a student’s CV.
Speaking of American college students, we have seen more interest in online education and politics, which is not surprising, considering the situation. The majority of college learners decided to approach social media by recording helpful videos that would explain the situation in their city, town, or even the entire state. It shows that American youth is becoming more responsible, which is a good sign and proves that people could become more united than ever. Our Nerdify reviews team suggests that you should think about starting a blog or at least writing some of your thoughts down because history is made today and you are the future!
The students in Italy, a country that has been badly affected by the Covid-19, decided to focus their energy on the recovery of the artworks, monuments and cleaning the walls from the writings that do not represent any cultural value. They do not talk about graffiti and the local artists but about keeping the city and Rome, in particular, a better place. It is done with the hope that the travel bans will be lifted soon and that tourists from all over the world will be able to enjoy beautiful Italy.
Students in Brazil also decided to take care of the local environment and went to help clean the local beaches and the streets. For some reason, the officials did not support this particular initiative, yet after a little while the police forces have joined the youth and the situation has changed in a positive way. Both young and old would clean the streets day and night and share pictures online that would show how a single person could make a difference even though the challenging times.
Canadian students decided to make the local traveling possible by creating numerous slideshows with short guides about the parks, rivers, First Nations People, and many other topics that would pose an interest for both locals and future foreign tourists. They would handle leaflets with the URLs to the local virtual museums and the libraries where everyone could download books for free or take virtual tours online.
Summing things up, we can see that there is still hope for humanity and that people do care. As they say, united we stand, divided we fall!
-
January 10, 2019
We’ve got a feedback story from our grateful customer who decided to share his success story and help students who struggle with the chi-squared test.
This article contains a full and really simple guide to solving chi-square. To keep his identity anonymous, we’ve changed his name.
I’m Donald and this is my story about conquering chi-square. Einstein was completely right saying that, “If you can’t explain it to a six-year-old, you don’t understand it yourself.”
If you’re currently struggling with the chi-square test, I’ll answer all — and I mean all — your questions about this tricky statistical method in really easy to understand terms!
I’ve adapted this article from the “Methodology” section of my paper. You are welcome to use it to understand how the methodology of your own homework should work.
What is the Chi-Square Test and Where to Use It?
The first time I had to use chi-square was when I was at the 4th year of my undergraduate program at Pittsburgh University School of Nursing. I planned to prove that googling about mental health issues can cause anxiety and negative emotions.
Thus, the topic of my paper was “How reading of online resources about mental health issues impacts patients’ mental and emotional state”.
I surveyed 100 patients. I asked them how often they read about health issues, and whether such a guilty pleasure triggers their anxiety. Then, I recorded their answers on a table.
All I needed was to find the right statistical test. I looked through a short chi-square guide online and it totally triggered my math anxiety.
You know, I felt that I’m the dumbest person in the world. Thankfully, I did not give up and continued.
At the end of the day, Donald resolves his case — being mentored by a professional Nerd.
Let Nerdify find your perfect academic match using AI! 🤖
❓ What is the Chi-Square Test?
First things first, I got to know my enemy. Chi-square test is a common statistical method used to determine whether two things (in statistics they are called variables) are somehow related.
❓ How to find out whether variables are related? If one variable somehow changes, and another immediately changes in response, it means that they are related.
This is actually very simple to understand once you put the concept of chi-square in the context of a real example.
In my case, patients would be reading about health issues online and experience anxiety. If they feel bad after browsing horrifying symptoms of mental illnesses on WedMD, that means these variables are related.
To make sure that the chi-square method suits your particular research, check these criteria:
- You need to analyze numerical results — specifically, the numbers of times you’ve observed something happening, or how many people gave the same response.
- Variables are categorical — variables should belong to specific groups. For instance, respondents in surveys can be categorized by gender, age, political views, etc.
- There are two individual variables (e.g. how frequently people google online about mental illnesses (very frequently or rarely) and the effect of their googling (increased anxiety or no negative emotions)
- You only need a “yes” or “no” answer – chi-square can only tell if two variables influence each other. It never tells how strong the influence is and when or why it occurs.
Chi-square is used pretty much anywhere because it is a simple, suitable for any sample size, and cheap way to test whether two variables are related. For instance:
- In healthcare: is anxiety associated with online research about health issues?
- In sociology: is crime rate related to the poverty level in a specific region?
- In marketing: do sales depend on the region where products are sold?
- In politics: does voter turnout depend on voter age?
Given all this info, I decided that chi-square was exactly what I needed for my research. But how to convert my data into a table and then get all the calculations done right? After 5 days of trial and error, all I had was only errors and I got stuck.
Why Chi-Square Test is Mistakenly Thought to be Difficult?
You’d think that the good old Google knows everything, but nope. Page after page of the search results, I saw the same explanations by-the-book, which were all Greek to me. Without statistical education, I got the theoretical part but was completely lost when it came to practice.
Then a friend of mine recommended me Nerdify. Nerdify connected me with a perfect Nerd — a Master in Medical Statistics and finally, I knew I was going somewhere!
A detailed explanation from the Nerd on how chi-square works and how I should use it — it was all that I needed to nail my super difficult paper.
Why was chi-square so difficult for me? As my Nerd said, it happens with all the students for the following reasons:
- Extremely complex definitions and explanations that make chi-square seem very entangled and confuse students
- Without illustrative examples, complex formulas are overwhelming for anyone who does not have a fancy for math.
- Lack of time teachers can devote to explaining every topic — students often have no one to ask for an extra explanation
- Lack of knowledge due to that your major doesn’t have anything to do with statistics. As a student nurse, I didn’t have any background in studying statistics at all.
Want a Personal Nerd to step in and make your test easier?
- Explain formulas?
- Provide real-life examples?
- Mentor customization of statistical methods to your project?
📲 Message Nerdify to get help!
If you’re struggling just as I did, for whatever reason, I’ve got a perfect step-by-step guide to chi-square that you can use!
Really Simple Step-by-Step Chi-Square Guide
Right off the bat, you should know that it’s totally acceptable for non-statistics students to skip doing all the calculations manually and use online chi-square test calculators.
However, my college professor required all the chi-square formulas explained in the paper. Thus, if you’ll use chi-square, you need to understand this method to interpret the results correctly.
▶ Formula Explained
When you see this abomination of a formula, you probably think it’s extremely complex:
where
- χ2 — value of chi square
- Σ — sign of sum, means the total amount of elements in a sequence
- O — observed value of a variable, or the numbers you already have from observations or task description
- E — expected value of variables you need to calculate yourself; they represent how the variables would be distributed if there would be NO relationship between the variables
Even if you do all the calculations using MS Excel or SPSS, you still need to know where to put which number!
In sections below, you fill find out more about where to find these numbers.
Now it’s time for the best part — calculations!
0️⃣ My Case ➕ Sample Size
In my research, I surveyed 100 patients. I asked them how often they read about health issues, and whether such a guilty pleasure triggers their anxiety
- So there were two categories of patients: those who frequently research health issues and those who rarely research them
- There were also two options of their emotional response: increased anxiety and no changes
Right now, I know my sample size — the number of observations. How many people responded to the survey? How many times you’ve seen something happening during the experiment or study?
In my case, sample equaled 100 — the number of people who participated in the survey.
1️⃣ Creating a Chi-Square Table
Using this data, I created this contingency table:
❓ Contingency tables present observations in matrix format — rows and columns, just like the table above. This type of tables is very commonly used in statistics, especially because it demonstrates how two variables are connected.
Increased anxiety No changes Total Frequently research Rarely research Total
2️⃣ Choosing Statistical Significance
If you’re writing a paper using the chi-square method, chances are that the level of statistical significance isn’t given. Where do you get it? You choose it yourself!
❓ Statistical significance — is the likelihood of that the relationship between two or more variables is accidental and the results of the observation are caused by something else than just chance.
For instance, if a patient gets anxiety every time he does online research about health issues, then statistically the probability of getting anxiety, aka level of confidence is 100%, or 1.
If a patient gets anxiety in 9 times out of 10, then we can confidently state that the probability here is 90%, or 0.9.
The most typical levels of significance are 0.05 and 0.01 — both are 100% safe to use in your paper. I chose 0.01 because the lower the value, the more significant results you’ll get — lower significance implies a lower risk of error.
Why do we need the level of significance? My Nerd had a good metaphor to explain it. Imagine that you have to climb up a ladder that has 100 steps. The more steps are missing, the higher the risk that you’ll fall. That’s why we set a very low level of significance — to make sure that calculations are correct!
3️⃣ State your Hypotheses
The hypothesis is a fancy word that confuses many students, but in reality, the hypothesis is just an assumption that you have. In chi-square, you’ll need 2 of them.
- Null hypothesis (H0)– usually states that the results of the observations could result purely from chance and the variables are independent — if one of them changes, another one stays the same and doesn’t react to the changes in the first one.
My H0 would say that getting anxiety isn’t connected with researching health issues online.
- Alternative hypothesis (H1) states that the sample observations result not from a random cause, but from a specific cause and the variables are dependent in some way.
That is, my H1 says that patients really do get anxiety and experience negative feelings after researching health issues online.
4️⃣ Fill in Observed Values
Here just enter all the observed values into the table:
❓ Observed value — what actually happened or how many times you’ve seen something occur. For instance, how many respondents out of 100 admitted to frequently research online about mental issues and get anxiety from it
Increased anxiety No change Total Frequently research 36 9 45 Rarely research 24 31 55 Total 60 40 100
5️⃣ Calculate Expected Value
Here we calculate values that would be observed in case if there would be no relationship between researching health issues and experiencing negative emotions.
❓ Expected value — it’s calculated by the formula below and show what would happen if the variables were absolutely independent — wouldn’t affect each other at all.
where
- E — expected value
- Mr — row total for the cell you’re calculating an expected value for
- Mc — column total for that cell
- n — sample size
Increased anxiety No change Total Frequently research 27 18 45 Rarely research 33 22 55 Total 60 40 100
- Expected value for “frequently research, increased anxiety” E=45*60/100=27
- Expected value for “only rarely research, increased anxiety” E=55*60/100=33
- Expected value for “frequently research, no negative emotions” E=45*40/100=18
- Expected value for“only rarely research, no negative emotions” E=55*40/100=22
6️⃣ Calculate Chi-Square Using the Formula
Once again, you can use online calculators, but this how it’s done in practice (aka the hard way):
Not ready yet to move further with chi-square test?
Find your Nerd to ease your pain. In anything. Unless it’s legal. 😎
🧐 Get Connected to a Personal Nerd!
7️⃣ Calculate Degrees of Freedom and Critical Value
Now that we got chi-square calculation done, let’s calculate the degrees of freedom
❓ Degrees of freedom (df) — the number of independent variables that went into the calculation.
Just think of those promotions “buy 2 — get 1 for free!” — you’re free to choose several things, but +1 product is always set by the promotion. Degrees of freedom, however, subtract 1 from both your rows and columns.
You need to use a chi-square distribution table and find your critical value at the intersection of the degrees of freedom (df=1) and the level of significance (α=0.01):
So, our critical value is 6.63. This value is smaller than our χ2 =13.63 Therefore, in our chi-square test example, researching about health issues online and getting anxiety or negative emotions are related.
We don’t know how much they are related, because chi-square doesn’t answer this question. But we definitely know that they are somehow related.👌
Chi-Square Calculators — the Easy Way
Even if you need to do all the difficult calculations by yourself, these calculators are awesome to verify your results. Or, if you’re lucky, online calculators are all you’ll need to use to calculate chi-square!
- Social Science Statistics Calculator — easy to use chi-square calculator that can calculate up to 5 rows and 5 columns. You can enter category names, fill in the data, and get the result in a flash.
- Kent University SPSS Guide for Chi-Square — if you have SPSS, you can consider your chi-square test pretty much already done. This guide will help you learn how to import chi-square tables and graphs into the SPSS and get the task solved. Many colleges and universities use SPSS as their default tool, and your professor may ask you to show your SPSS datasheet.
- Chi-Square Calculator — another extremely simple online chi-squared test calculator. All you need to do is enter the observed values and you’ll get degrees of freedom and chi-square ready.
How Can You Nail Chi-Square: My Pro Tips
If anyone told me I would be able to do it just a week before connecting with a Nerd, I’d never believed it. It was simple and logical explanations from my Nerd that helped me completely nail chi-square test and do all the calculations by myself.
Now, I understand each step of chi-square and interpret results correctly. For me, it was crucial that a professional, with a background in studying and applying statistics in practice, would explain everything to me in human language, not math language.
And now a few tips for you to cut corners if you’re dealing with chi-square:
- Keep in mind that chi-square isn’t rocket science — it is doable and actually very easy if you have a really simple and detailed guideline
- The number of rows and columns can vary and your table can be much larger than mine, however, the principle remains the same — you’ll just need to do more arithmetic
- When calculating the expected value, you’ll most likely get fractions, which can confuse you, especially if you’re calculating the number of people in each category. Don’t bother about it — these calculations are intended for further calculation of chi-square
That’s all I wanted to share in my feedback story today. Hopefully, it will help you nail chi-square and get the grade you deserve! Chi-square isn’t as difficult as it may seem at first, so go ahead and break a lance!
Of course, you can make your own success story too!
Nerdify is an AI-powered platform to quickly connect with the experience of 1000s of Personal Nerds
-
March 18, 2021
Living in the world of technology and a constant exchange of information, our minds are constantly running several tasks at once, which makes it extremely difficult to memorize things. Our Nerdify reviews team decided to explore this issue a little bit further to come up with a list of helpful methods that would keep our brains active and relaxed at the same time. As an example, we started asking each other about what helps us to memorize or keep things in the active particle of our brain. It appears that some of us learn with the help of visual associations, while others memorize things according to their importance to them.
1. Visual Association. The most popular method to memorize things is to approach various visual associations that relate to important concepts, unknown words, or even entire processes that relate to such complex matters as nursing or the law. It is the method that is also used by intelligence all over the world since the visual aspect motivates our brain and helps us to keep things refreshed each time we think of a certain picture, image, or drawing. It is also a reason why the use of flashcards is so important not only for young children but for college students as well.
2. The Order of Importance. One person at the Nerdify reviews has surprised us by saying that she memorizes only those things that seem important to her. While it may sound true for most cases, it still poses a question as to how one can keep those not-so-important things in mind. A solution has been found in a while as another person in our team came up with an example of college assignments. All it takes is making things important by changing them or by connecting something to what matters to us. If it is important and keeps you inspired, you will remember it “just because…”
3. Reading Keeps Your Brain Alive. Unfortunately, reading books is becoming less popular these days as most college students prefer playing video games, chatting online, or watching the latest Netflix’s offerings. In truth, as the Nerdify reviews team could find out, reading books stimulates our brain and helps to activate the cognitive functions that are responsible for our memory and processing of things. As we read, our brain forms a mental matrix that keeps things memorized, so we can proceed to the next page while remembering all the things that took place before.
4. Writing Things Down. The same can be said about writing things down because it helps to form the tone, analysis, and strategic thinking. Of course, one can start writing without thinking much over it, yet our sentences are still forcing our brain to think and shape separate words together. Remember that typing something online is not the same as writing something down on paper. While you can easily delete something you have typed, writing with a pen requires care for detail and more responsibility, which is a great way to think twice and train one’s memory as to how to do something right.
5. The Word Games. We all have heard about the quiz nights, yet why not make it a regular practice to boost one’s brain and help us to remember things? If you make it a regular experience, as we did at Nerdify reviews, your brain will become accustomed to remembering things through the play and the games. As soon as there will come a moment to remember a phone number, a password, or a part of the important lecture, your brain will instantly engage in a familiar experience that has been acquired with the help of the word games.
6. The Art of a Spoken Word. Do you know how the movie stars remember their lines and keep so much text in their heads? It is because they practice the art of the spoken word. As they constantly talk it out and practice, they learn more about the structure of each line. It simply starts making sense to them! Try using the same practice when you need to remember something and practice a speech in front of a mirror or record yourself to work on your social skills. It will boost your immediate memory and will help you to remember things professionally.
7. Learning how to Recite. Pick a book that you really like or take part of a story that you have to learn for your college course. Read it about 3-5 times, just a single passage. Try to recite it exactly the same way as you used to do during your middle school years. It is as simple as that – just continue with this good old practice until you learn entire paragraphs by heart. You will definitely thank us later as your memory starts to improve!